15. Visualising Data with Pandas
So far, you have learned how to use pandas to create, inspect, clean, sort, group, and analyse data.
But there is another important part of data analysis: presenting your findings in a way that people can understand quickly.
Imagine you have a table showing the monthly sales of a business.
You can read the numbers, but comparing several months may take time.
A chart can make the pattern much easier to see.
A chart can help you answer questions such as:
- Which month had the highest sales?
- Are sales increasing or decreasing?
- Which product sells the most?
- How are sales distributed across different categories?
- Is there a relationship between advertising and revenue?
This process is called data visualisation.
Pandas makes basic visualisation easier by providing a .plot() method that works with the Matplotlib library.
In this section, you will learn how to create common charts, customise them, and choose a suitable chart for your data.
15.1 Prepare Your Environment
Pandas uses Matplotlib as its default plotting backend.
If you are working in Google Colab, Matplotlib is usually already available.
If you are using a local Python environment and do not have it installed, run:
pip install matplotlib
Now import the libraries:
import pandas as pd
import matplotlib.pyplot as plt
The two libraries have different responsibilities:
pandashelps you organise and analyse data.matplotlib.pyplothelps you create and customise charts.
The following examples use pandas to prepare the data and Matplotlib to display and customise the charts.
15.2 Create a Dataset to Work With
Let's imagine a shop in Nairobi, Kenya, wants to analyse its monthly revenue.
We can create a simple DataFrame.
import pandas as pd
import matplotlib.pyplot as plt

sales = pd.DataFrame({
    "Month": ["January", "February", "March", "April", "May"],
    "Revenue": [12000, 15000, 11000, 18000, 22000]
})

print(sales)
Output:
      Month  Revenue
0   January    12000
1  February    15000
2     March    11000
3     April    18000
4       May    22000
This dataset contains five months of sales information.
Let's use it to create different types of charts.
15.3 Create a Line Chart
A line chart is useful when you want to show how something changes over time.
For example, you may want to see whether monthly revenue is increasing or decreasing.
Use the plot() method with kind="line".
sales.plot(
    x="Month",
    y="Revenue",
    kind="line",
    marker="o",
    title="Monthly Revenue"
)

plt.xlabel("Month")
plt.ylabel("Revenue (KES)")
plt.grid(True)
plt.show()
IMAGE CHART 1
The chart shows revenue changing from month to month.
You can see that:
- Revenue increased from January to February.
- Revenue decreased in March.
- Revenue increased again in April and May.
- May recorded the highest revenue.
The marker="o" argument adds a marker at each data point.
The plt.grid(True) command adds grid lines to make the values easier to read.
When should you use a line chart?
Use it when you want to show trends over time, such as:
- Monthly revenue.
- Daily website visitors.
- Weekly product sales.
- Annual business growth.
15.4 Create a Bar Chart
A bar chart is useful when you want to compare values across different categories.
For example, suppose you want to compare revenue generated by different products.
Let's create a new DataFrame.
products = pd.DataFrame({
    "Product": ["Rice", "Beans", "Sugar", "Cooking Oil"],
    "Revenue": [25000, 18000, 12000, 30000]
})

products.plot(
    x="Product",
    y="Revenue",
    kind="bar",
    title="Revenue by Product"
)

plt.xlabel("Product")
plt.ylabel("Revenue (KES)")
plt.xticks(rotation=45)
plt.show()
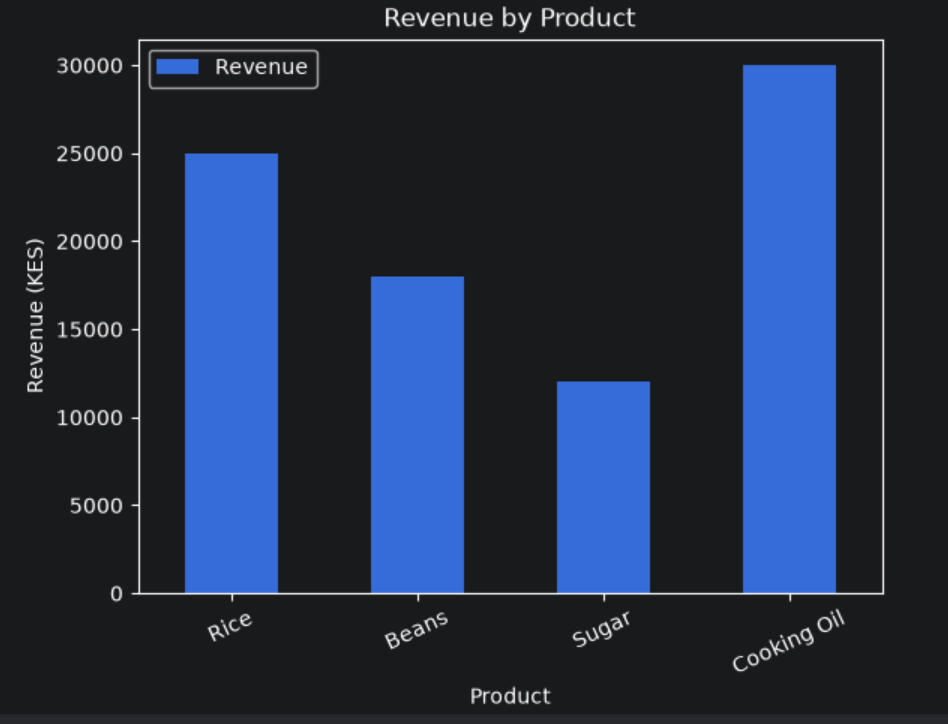
The chart displays a separate bar for each product.
You can quickly see that:
- Cooking Oil generated the highest revenue.
- Sugar generated the lowest revenue.
- Rice generated more revenue than Beans.
The plt.xticks(rotation=45) command rotates the category labels to make them easier to read.
When should you use a bar chart?
Use it when comparing categories, such as:
- Sales by product.
- Revenue by branch.
- Number of students by class.
- Orders by department.
15.5 Create a Horizontal Bar Chart
Sometimes category names are long.
A horizontal bar chart can make them easier to read.
You can create one by using kind="barh".
products.plot(
    x="Product",
    y="Revenue",
    kind="barh",
    title="Revenue by Product"
)

plt.xlabel("Revenue (KES)")
plt.ylabel("Product")
plt.show()
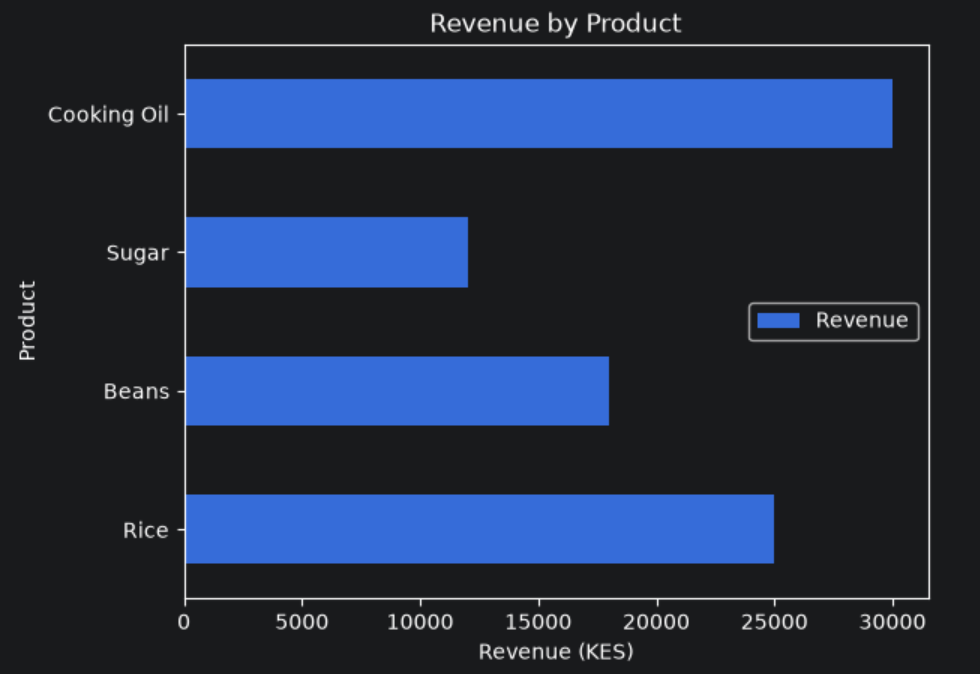
The bars are now displayed horizontally.
This is useful when your categories have long names or when you want to present a ranked comparison.
15.6 Create a Pie Chart
A pie chart shows how a total is divided among different categories.
For example, a business may want to understand how its revenue is distributed across product categories.
Let's create a dataset.
categories = pd.DataFrame({
    "Category": ["Food", "Drinks", "Household", "Personal Care"],
    "Revenue": [40000, 20000, 25000, 15000]
})

categories.plot(
    y="Revenue",
    kind="pie",
    labels=categories["Category"],
    autopct="%1.1f%%",
    title="Revenue Distribution",
    legend=False
)

plt.ylabel("")
plt.show()
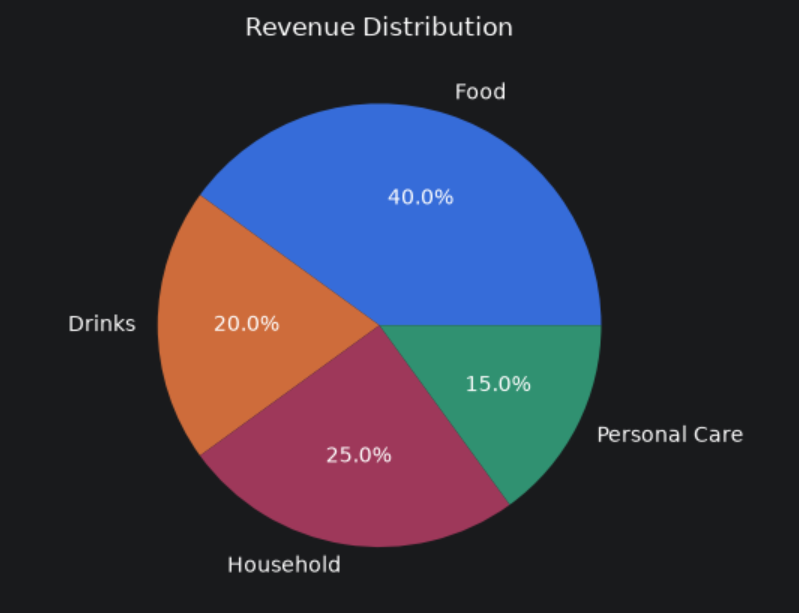
The chart displays the percentage contribution of each category to total revenue.
The percentages are:
- Food: 40%.
- Drinks: 20%.
- Household: 25%.
- Personal Care: 15%.
The autopct="%1.1f%%" argument displays each percentage to one decimal place.
When should you use a pie chart?
Use it when you want to show how a whole is divided into a small number of categories.
Avoid using pie charts when:
- There are too many categories (beyond 5).
- The values are very similar.
- You need to compare exact values accurately.
A bar chart is often easier to interpret in those situations.
15.7 Create a Histogram
A histogram helps you understand the distribution of numerical values.
For example, suppose a teacher wants to understand how students performed in an examination.
scores = pd.DataFrame({
    "Score": [45, 50, 55, 60, 62, 65, 68, 70, 72, 75,
              78, 80, 82, 85, 88, 90, 92, 95]
})

scores["Score"].plot(
    kind="hist",
    bins=5,
    title="Distribution of Student Scores"
)

plt.xlabel("Score")
plt.ylabel("Number of Students")
plt.show()
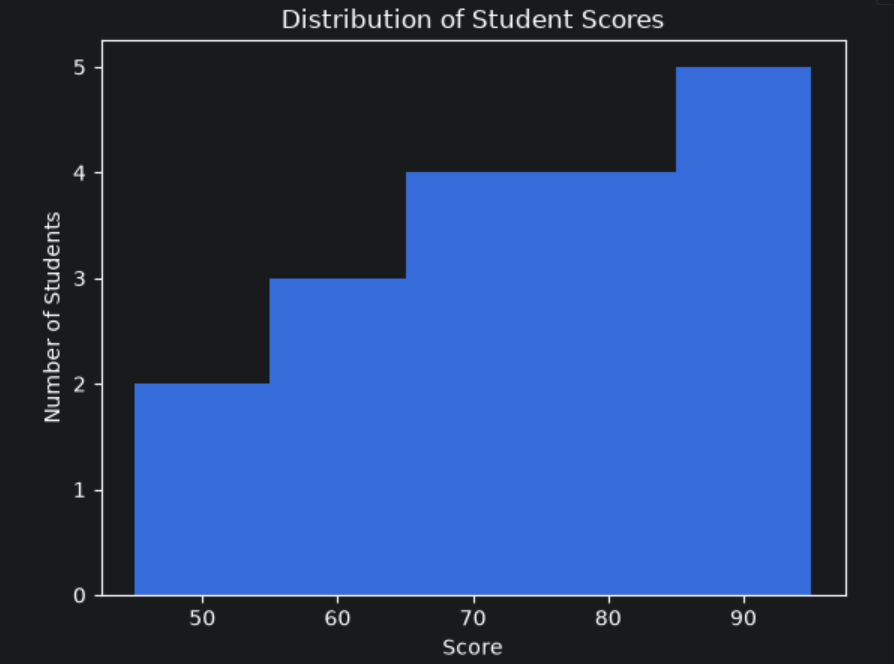
The histogram groups scores into intervals called bins.
It helps you see where most students' scores are concentrated.
For example, you may notice that many students scored between 70 and 90.
The bins=5 argument asks pandas to divide the data into five intervals.
When should you use a histogram?
Use it when you want to understand how numerical values are distributed.
Examples include:
- Examination scores.
- Customer ages.
- Product prices.
- Delivery times.
- Monthly income.
A histogram is different from a bar chart. A bar chart compares categories, while a histogram groups numerical values into intervals.
15.8 Create a Scatter Plot
A scatter plot helps you examine the relationship between two numerical variables.
For example, a business may want to understand whether advertising expenditure is related to sales revenue.
Let's create a simple dataset.
advertising = pd.DataFrame({
    "Advertising": [1000, 1500, 2000, 2500, 3000, 3500],
    "Revenue": [5000, 6500, 8000, 9500, 11000, 12500]
})

advertising.plot(
    x="Advertising",
    y="Revenue",
    kind="scatter",
    title="Advertising and Revenue"
)

plt.xlabel("Advertising Spend (KES)")
plt.ylabel("Revenue (KES)")
plt.show()
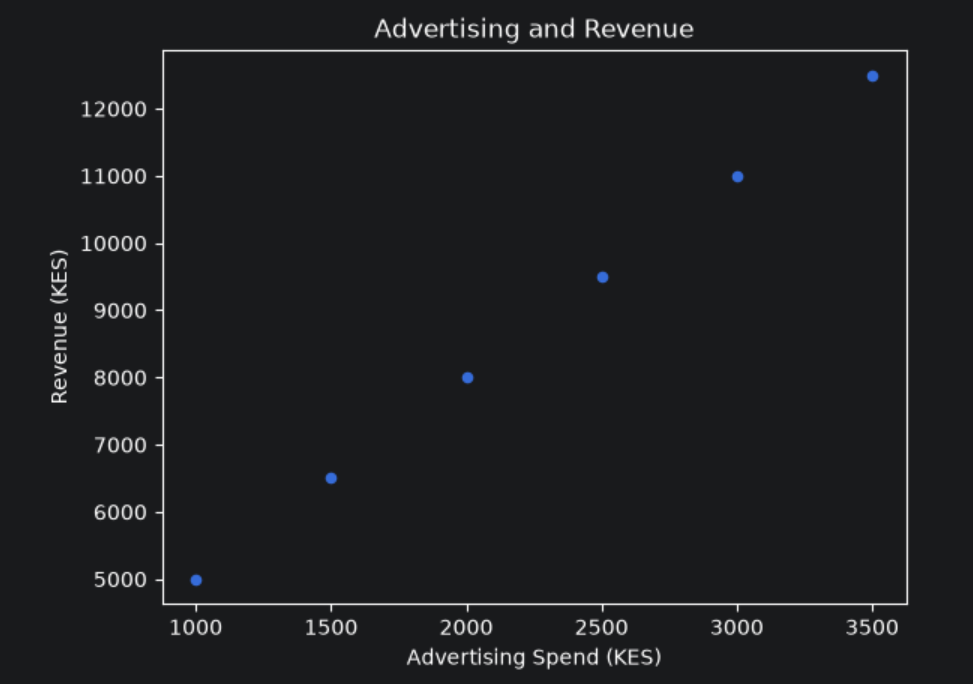
Each point represents one observation.
The chart shows an upward pattern: higher advertising expenditure is associated with higher revenue in this small dataset.
However, this does not prove that advertising caused the increase in revenue. Other factors may also have influenced sales.
When should you use a scatter plot?
Use it when you want to explore relationships between two numerical variables, such as:
- Advertising expenditure and revenue.
- Study hours and examination scores.
- Product price and quantity sold.
- Temperature and electricity consumption.
15.9 Customise Your Charts
A chart should communicate information clearly.
Pandas allows you to pass several options to .plot(), while Matplotlib provides additional controls.
Here is an example of a customised line chart.
sales.plot(
    x="Month",
    y="Revenue",
    kind="line",
    marker="o",
    title="Monthly Revenue Performance",
    figsize=(9, 5),
    grid=True
)

plt.xlabel("Month")
plt.ylabel("Revenue (KES)")
plt.xticks(rotation=45)
plt.tight_layout()
plt.show()
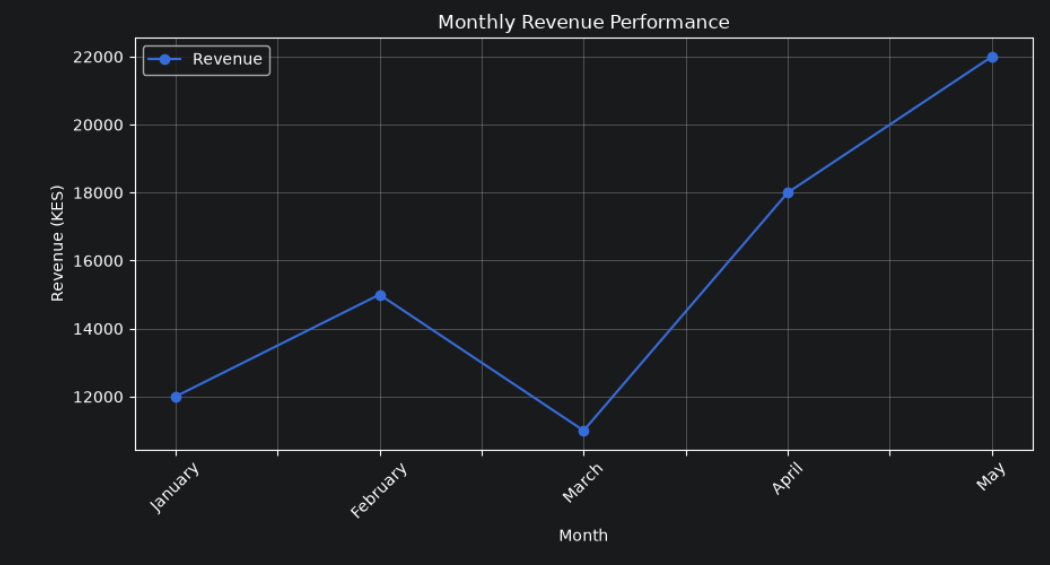
Let's understand the additional options.
| Option | Purpose |
|---|---|
title |
Adds a chart title |
figsize |
Sets the chart dimensions |
marker |
Adds markers to data points |
grid=True |
Displays grid lines |
xlabel() |
Labels the horizontal axis |
ylabel() |
Labels the vertical axis |
xticks(rotation=45) |
Rotates horizontal-axis labels |
tight_layout() |
Adjusts spacing to prevent labels from being cut off |
show() |
Displays the chart |
You can also add a legend when comparing multiple columns.
For example:
monthly_comparison = pd.DataFrame({
    "Month": ["January", "February", "March", "April"],
    "2025": [10000, 12000, 14000, 15000],
    "2026": [12000, 15000, 16000, 18000]
})

monthly_comparison.plot(
    x="Month",
    y=["2025", "2026"],
    kind="line",
    marker="o",
    title="Monthly Revenue Comparison"
)

plt.xlabel("Month")
plt.ylabel("Revenue (KES)")
plt.legend(title="Year")
plt.grid(True)
plt.show()
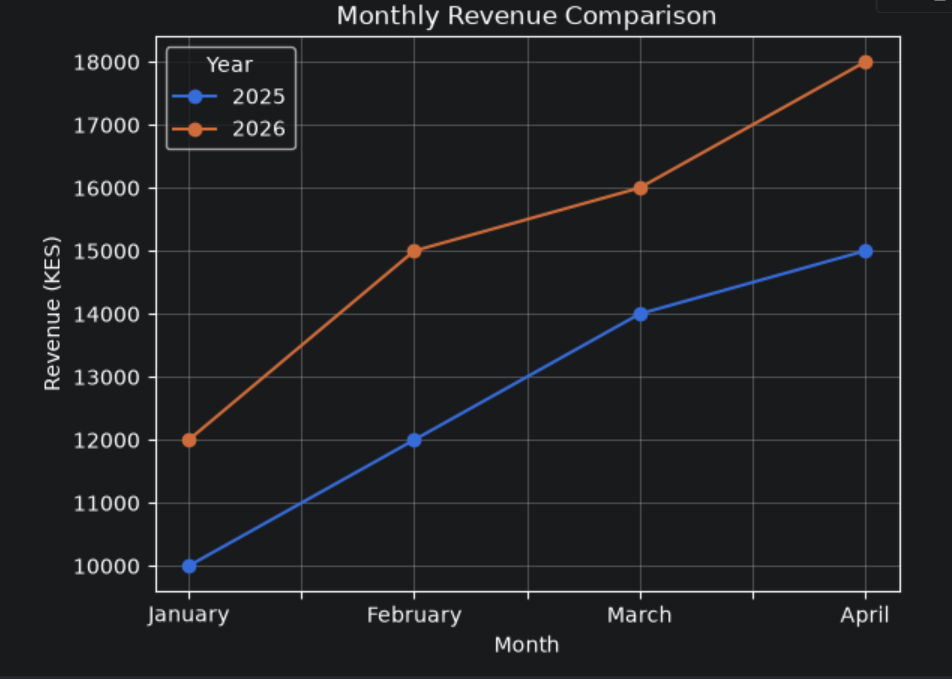
This chart compares revenue across two years.
The legend helps readers identify which line represents each year.
15.10 Choose the Right Chart
Different charts answer different questions.
Here is a simple guide:
| Chart | Best used for |
|---|---|
| Line chart | Trends and changes over time |
| Bar chart | Comparing categories |
| Horizontal bar chart | Comparing categories with long labels |
| Pie chart | Showing parts of a whole |
| Histogram | Understanding numerical distributions |
| Scatter plot | Exploring relationships between two numerical variables |
Choosing the right chart is important.
A chart can be technically correct but still make information difficult to understand if it is not suitable for the question.
Before creating a chart, ask yourself:
What do I want the reader to understand from this data?
Then choose the chart that communicates that message most clearly.
15.11 A Complete Practical Example
Let's put several skills together.
Suppose a shop manager wants to compare monthly revenue, identify the highest-performing month, and display the results in a chart.
import pandas as pd
import matplotlib.pyplot as plt

sales = pd.DataFrame({
    "Month": [
        "January", "February", "March",
        "April", "May", "June"
    ],
    "Revenue": [
        12000, 15000, 11000,
        18000, 22000, 20000
    ]
})

# Calculate total revenue
total_revenue = sales["Revenue"].sum()

# Find the month with the highest revenue
best_month = sales.loc[
    sales["Revenue"].idxmax()
]

# Calculate average monthly revenue
average_revenue = sales["Revenue"].mean()

print("Total Revenue:", total_revenue)
print("Average Revenue:", average_revenue)
print("Best Performing Month:", best_month["Month"])
print("Highest Revenue:", best_month["Revenue"])

# Create a bar chart
sales.plot(
    x="Month",
    y="Revenue",
    kind="bar",
    title="Monthly Revenue Performance",
    legend=False
)

plt.xlabel("Month")
plt.ylabel("Revenue (KES)")
plt.xticks(rotation=45)
plt.tight_layout()
plt.show()
Output:
Total Revenue: 98000
Average Revenue: 16333.333333333334
Best Performing Month: May
Highest Revenue: 22000
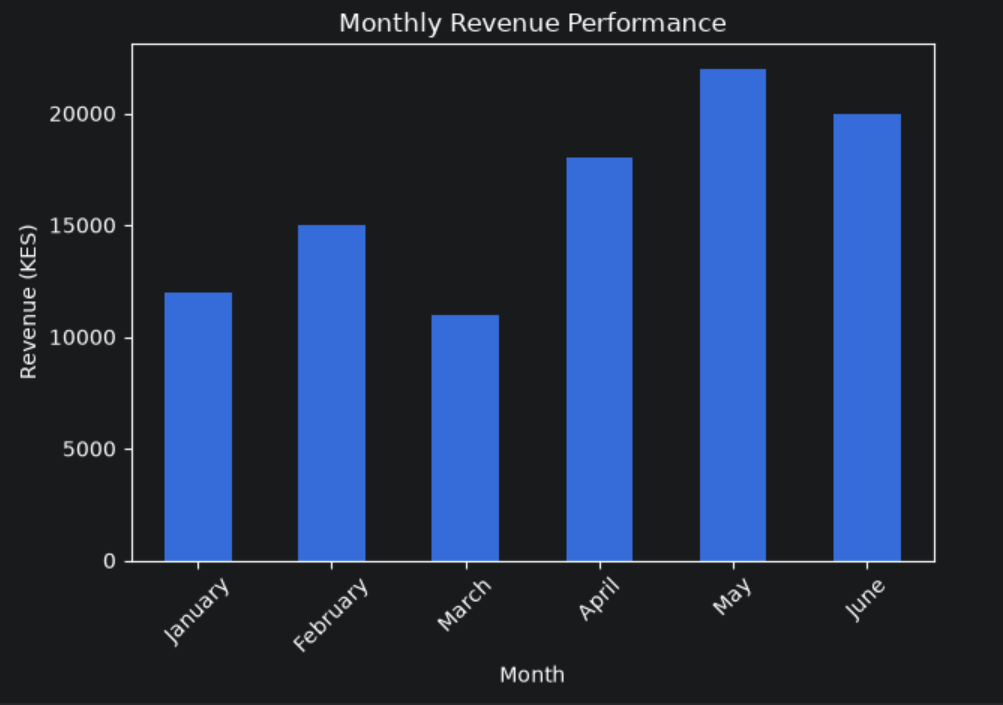
The chart gives the manager a visual comparison of monthly revenue.
The numerical calculations provide exact values, while the chart makes it easier to identify patterns.
This is an important principle in data analysis: use calculations to obtain accurate results and visualisations to communicate those results clearly.
15.12 Common Mistakes to Avoid
When creating charts with pandas, watch out for these mistakes.
1. Choosing the wrong chart
A pie chart is not always the best way to compare categories. A bar chart may communicate the differences more clearly.
2. Forgetting to label the axes
A chart without axis labels may leave readers guessing what the numbers represent.
3. Using too many categories
Too many bars or pie slices can make a chart difficult to read.
4. Ignoring missing values
Missing values can affect calculations and visualisations. Inspect and handle them appropriately before plotting.
5. Forgetting plt.show()
In many notebook environments, charts display automatically. In ordinary Python scripts, calling plt.show() ensures that the chart is displayed.
6. Treating correlation as proof of causation
A scatter plot may show that two variables move together, but that does not automatically mean one causes the other.
15.13 What You Should Remember
In this section, you learned how to create:
- Line charts using
kind="line". - Bar charts using
kind="bar". - Horizontal bar charts using
kind="barh". - Pie charts using
kind="pie". - Histograms using
kind="hist". - Scatter plots using
kind="scatter".
You also learned how to customise charts with titles, axis labels, legends, grid lines, and figure sizes.
The most important lesson is that data visualisation helps you communicate what your analysis reveals.
A table may contain all the numbers, but a well-designed chart can make important patterns much easier to notice.
In the next section, we will explore how to export pandas DataFrames to files such as CSV and Excel, so you can save your analysis and share it with other people.
About the author
- Passionate about the intersection of data and technology in practical problem solving. Writing about Python, SQL, PostgreSQL, and Power BI; creating practical systems that transform data into meaningful insights and facilitate better decision-making. Always learning, building, and sharing knowledge along the way. . .
Comments
Join the discussionNo comments yet. Be the first to comment.